Meeting of the Board of Regents | June 2009
|
|
THE STATE EDUCATION DEPARTMENT / THE UNIVERSITY OF THE STATE OF NEW YORK / ALBANY, NY 12234 |
|
TO: |
Higher Education Committee
|
|
FROM: |
Johanna Duncan-Poitier
Rebecca H. Cort
|
|
SUBJECT: |
Policy Issues Concerning Graduation Rates – Part I: Establishing a Graduation Rate and Annual Targets for Accountability
|
|
DATE: |
June 12, 2009 |
|
STRATEGIC GOAL: |
Goals 1 and 2
|
|
AUTHORIZATION(S): |
|
SUMMARY
Issue for Discussion
What policy decisions do the members of the Board of Regents want to make concerning New York State high school graduation?
Reason(s) for Consideration
Review of Policy.
Proposed Handling
The question will come before a joint session of the EMSC, VESID and Higher Education Committees for discussion in June 2009.
Graduation Rate
In New York State, for purposes of school and district accountability, the definition of a high school graduate includes students who complete high school with a local diploma, Regents diploma or Regents diploma with Advanced Designation. Students who receive a General Equivalency Diploma (GED) or an individualized education program (IEP) diploma are not considered graduates for this purpose. Beginning with students who entered ninth grade in 2008, general education students will no longer have the option to receive a local diploma under current regulations. To receive a Regents diploma, these students must score 65 or above on 5 required Regents exams and earn 22 units of credit. To receive a Regents diploma with Advanced Designation, students must score 65 or above on 8 required Regents exams and earn 22 units of credit. Students with disabilities still have the option of earning a local diploma.
.
The members of the Board of Regents are committed to increasing the number of students who graduate from high school and are interested in setting a new graduation rate goal and annual targets. The Regents have adopted a P-16 Education Plan that outlines actions to raise achievement overall, close the achievement gap and increase high school graduation rates and college success. This month the Board will be discussing its long-term focus on graduation by making a series of major policy decisions. In May, the Regents began a discussion of graduation requirements by exploring the issue of whether New York should increase the graduation rate goal and adopt an extended-year graduation rate cohort.
I. Situation Analysis
The Regents have developed a list of policy decisions and data needed to inform this policy discussion regarding the establishment of a new graduation rate goal and annual targets. To fully inform the policy decisions, the Board is being provided with an overview of those issues and associated data that first need to be carefully considered.
A. The graduation rate for all student groups that are far from the current statewide graduation rate including English Language Learners, students with disabilities, black and Hispanic students.
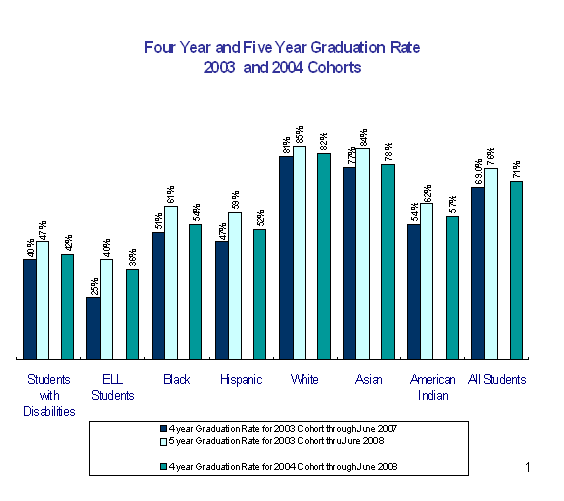
The graduation rates for the 2003 and 2004 cohorts (students who graduated in June of 2007 and 2008) are as follows:
All Students
- 2003 Cohort – 4 year graduation rate: 69%
- 2003 Cohort – 5 year graduation rate: 74%
- 2004 Cohort – 4 year graduation rate: 71%
- 2004 Cohort – 5 year graduation rate: not yet available
Disaggregated Student Subgroups
Students with Disabilities
- 2003 Cohort – 4 year graduation rate: 40%
- 2003 Cohort – 5 year graduation rate: 47%
- 2004 Cohort – 4 year graduation rate: 42%
- 2004 Cohort – 5 year graduation rate: not yet available
English Language Learners (ELL) Students
- 2003 Cohort – 4 year graduation rate: 25%
- 2003 Cohort – 5 year graduation rate: 40%
- 2004 Cohort – 4 year graduation rate: 36%
- 2004 Cohort – 5 year graduation rate: not yet available
Black Students
- 2003 Cohort – 4 year graduation rate: 51%
- 2003 Cohort – 5 year graduation rate: 61%
- 2004 Cohort – 4 year graduation rate: 54%
- 2004 Cohort – 5 year graduation rate: not yet available
Hispanic Students
- 2003 Cohort – 4 year graduation rate: 47%
- 2003 Cohort – 5 year graduation rate: 59%
- 2004 Cohort – 4 year graduation rate: 52%
- 2004 Cohort – 5 year graduation rate: not yet available
White Students
- 2003 Cohort – 4 year graduation rate: 81%
- 2003 Cohort – 5 year graduation rate: 85%
- 2004 Cohort – 4 year graduation rate: 82%
- 2004 Cohort – 5 year graduation rate: not yet available
Asian/Pacific Islander Students
- 2003 Cohort – 4 year graduation rate: 77%
- 2003 Cohort – 5 year graduation rate: 84%
- 2004 Cohort – 4 year graduation rate: 78%
- 2004 Cohort – 5 year graduation rate: not yet available
American Indian/Alaskan Native Students
- 2003 Cohort – 4 year graduation rate: 54%
- 2003 Cohort – 5 year graduation rate: 62%
- 2004 Cohort – 4 year graduation rate: 57%
- 2004 Cohort – 5 year graduation rate: not yet available
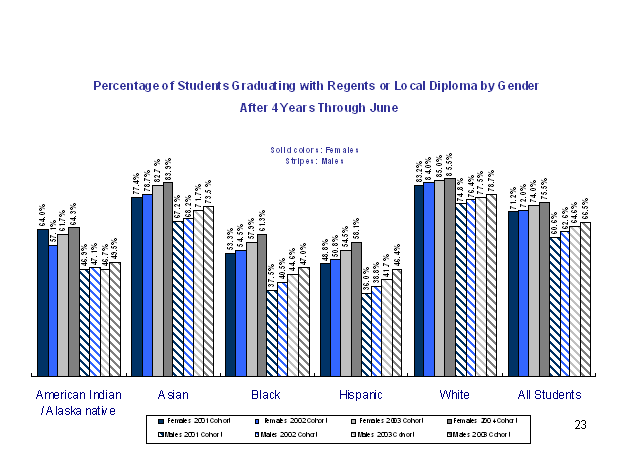 The following chart shows the graduation rates for all students and student groups by gender.
B. The impact of phasing out the local diploma for general education students.
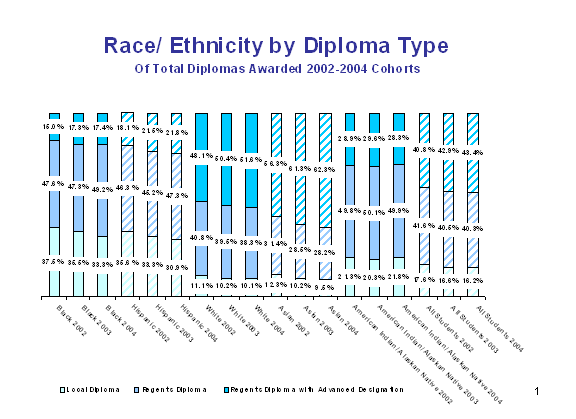
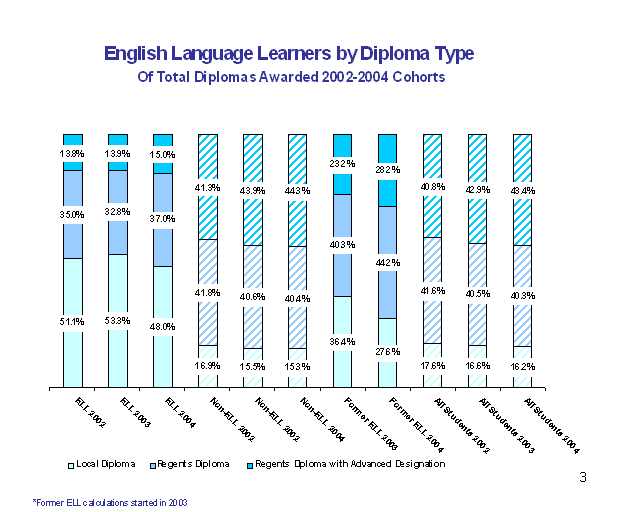
Sixteen percent of all students who graduated in June 2008 received a local diploma instead of the Regents or Advanced Regents Diploma.
- 33 percent of Black students received a local diploma
- 31 percent of Hispanic students received a local diploma.
- 9.5 percent of Asian/Pacific Islander students received a local diploma
- 10 percent of White students received a local diploma
- 22 percent of American Indian/Alaskan Native students received a local diploma
- 50 percent of students with disabilities received a local diploma.
- 48 percent of English Language Learners receive a local diploma.
The charts that follow show the percentage of all students and a breakdown by student groups in the 2002, 2003 and 2004 cohorts who received local diplomas.

C. The reliability of the data that districts report and related issues.
In a recent audit of the 2002 cohort after four years, the State Comptroller found that a number of schools had not kept adequate records of transfers. As a result, four of the 12 high schools audited reported graduation rates that were inaccurate by more than five percentage points. This information must be reviewed and considered as the Board of Regents proceeds with policy decisions regarding graduation rates.
The Department is also in the midst of major advances in data collection and reporting, organizationally and technologically. These actions will foster timelier and greater accuracy in data collection and reporting.
Some of the major improvements either implemented or that are underway include:
- Alerting districts of possible errors based on inconsistent data and significant changes in data from year to year;
- Electronic checks for the reasonability of data;
- Electronic checks to help eliminate “false dropouts” and “false transfers;”
- Restructuring the data system to allow districts to see and review edited data earlier in the process;
- Continuing to expand communication and training using technology to help to address resource limitations.
D. Current Graduation Rate in New York State and other States
Different States use a variety of methods to calculate the graduation rates they report to USED for accountability purposes. Some states, including New York, use the Cohort Rate, which calculates the percent of students from an entering ninth grade cohort who graduate with a regular diploma (local or Regents diploma) in four years. Many states use the Leaver Rate, which calculates graduation rates by dividing the number of students who received standard high school diplomas by the total number of students who have dropped out, graduated with a standard diploma and graduated with other completion credentials. The remaining states use a variety of indicators as proxies for graduation rates such as, completion ratios, grade-to-grade promotion rates and dropout rates. The variations in calculation methods means that the graduation rates reported for NCLB purposes are not comparable across states.
To illustrate how calculations differ, this month, Education Week issued a report, Diplomas Count 2009, which includes a chart that displays graduation rates for every state. This chart (Attachment A) was created by the EPE Research Center which used a Cumulative Promotion Index (CPI) method to calculate the aggregate graduation rates for the classes of 1996 and 2006, a trend marker to show if the graduation rate is higher, lower or the same, and disaggregated graduation rates by student group for the class of 2006. This chart shows that New York had an aggregate graduation rate of 68.3 percent for the class of 2006 (which would be the 2002 cohort) which is a 7.2 percent increase over the 1996 graduation rate of 61.1 percent. The national average for 2006 was 69.2 percent.
Graduation rate accountability determinations about schools and districts are based upon whether or not the school or district has met the graduation rate goal established by the state, or, alternatively, whether or not the school or district has met the established annual graduation rate target. The annual target establishes the degree of continuous and substantial improvement the student accountability groups that have not yet reached the graduation rate goal must make each year toward the goal. If the school or district has not met either the graduation rate goal or the annual target for two consecutive years it has not made Adequate Yearly Progress (AYP) and is identified as in need of improvement.
New York State’s current four-year graduation rate goal for accountability purposes is 55% and the annual graduation rate target is a 1% increase for schools and districts below the goal. Schools and districts that do not meet the goal or target for two consecutive years have not made AYP and are identified as in need of improvement. Attachment B lists the current graduation-rate goals and improvement targets for all states. As mentioned previously, the methods used by states to calculate graduation rate goals and targets differ significantly.
New York State’s current aggregate four year graduation rate for the 2004 cohort through June 2003 cohort through June 2007 is 69% and through August 2007 is 71% which is substantially better than the accountability goal of 55%. However, AYP decisions are currently based only on a school’s or a district’s aggregate graduation rate, not the disaggregated graduation rate for racial/ethnic, low-income, students with disabilities, or English language learner groups. This means that right now, as long as a school or district has met the goal or target for the “all students” group they have made AYP even if the disaggregated groups have not met the goal or target. There are 153 high schools in New York State that are not meeting the current aggregate graduation rate goal of 55%.
Consistent with the Board of Regents focus to close the achievement gap for all students, the federal government has also asked that states disaggregate graduation rate data for accountability purposes determining AYP based on assessments administered beginning with the 2011-12 school year results. This will mean that, even if a school or district meets the goal or target(s) for the “all students” group, if it does not meet the goal or target(s) for all of the disaggregated student groups for which it is accountable , it will be identified as in need of improvement for those student groups. Based on the 2004 cohort data, the disaggregated data now reveals that, a total of 272 high schools would not meet the 55 percent accountability graduation rate goal for at least one student group or more, or 26.9% of the total number of NYS high schools --1003 high schools. The chart that follows shows how the number of schools that would not meet the goal for at least one student group and therefore be at risk for being identified as in need of improvement will increase as the goal is made more rigorous,
Number and Percent of Schools That Would Not Meet Disaggregated Graduation Rate Goals for at Least One Student Group
2004 Cohort Through August 2008
|
|
|
|
|
If the
|
The total number of schools that would not meet the goal for at least one student group would be:
|
Percent of total number of high schools in NYS
|
|
55% |
272 |
26.9% |
|
60% |
324 |
32.0% |
|
65% |
385 |
38.1% |
|
70% |
451 |
44.6% |
|
75% |
527 |
52.1% |
|
80% |
627 |
63.0% |
|
85% |
723 |
71.5% |
|
90% |
827 |
81.8% |
|
100% |
1003 |
99.2% |
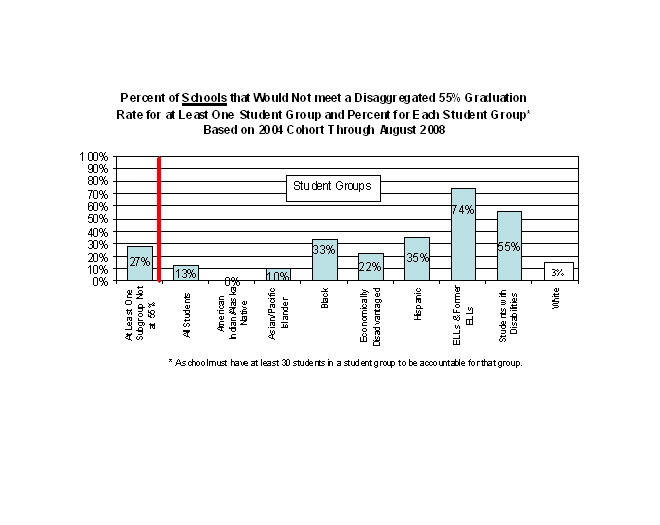 The next two charts break this data down further. The first chart shows the percent of schools accountable for each student group that would not meet the 55% graduation rate for each student group. Schools are included for each student group for which they are accountable.
To be accountable for a student group, a school must have at least 30 students in the group. The chart above shows that, for example, the disaggregated data by student group now reveals that 74 percent of the schools that would be accountable for the ELL group would not meet the 55 percent accountability graduation rate goal for that student group, 55 percent of the schools that would be accountable for the students with disabilities group would not meet the 55 percent graduation rate goal, etc. Schools can be accountable for more than one student group.
The chart that follows shows the same information by number rather than percentage. It shows the total number of high schools that would be accountable for each student group and the number that are not meeting a disaggregated 55% graduation rate for that student group. For example, there are a total of 288 high schools that would be accountable for students with disabilities as a group (because they have at least 30 students with disabilities), and 159 of those schools have a graduation rate below 55 for that group (highlighted in yellow). Similarly for example, there are 102 high schools that would be accountable for English language learners as a student group and 75 high schools have a graduation rate below 55 for that group (highlighted in pink). Schools are included for each student group for which they are accountable.
Number of High Schools Accountable for Each Student Group
That are Not Meeting a 55% Disaggregated Graduation Rate
2004 Cohort Through August 2008
|
|
all students |
Am. Indian Alaska Native |
Asian or Pacific Islander |
Black |
Econ Disadvantaged |
Hispanic |
ELLs and Former ELLs |
SWD |
White |
|
# of high schools with a Graduation Rate of less than 55 for each student group |
135 |
0 |
11 |
111 |
129 |
119 |
75 |
159 |
19 |
|
Total # of high schools accountable for each student group |
1011 |
2 |
100 |
334 |
591 |
340 |
102 |
288 |
707 |
II. What we Know about the Schools with low graduation rates and work in which the Board of Regents is involved
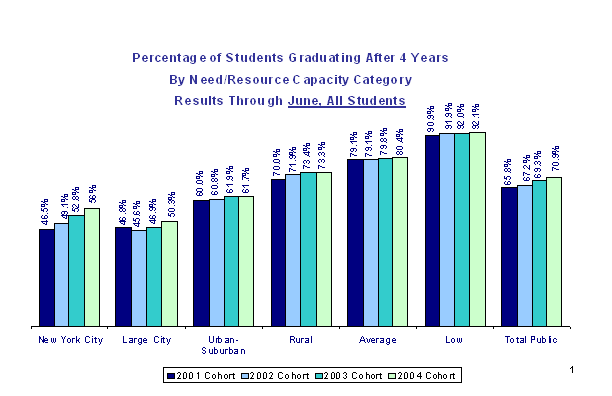
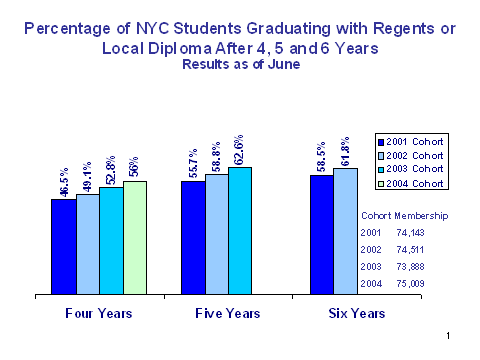
The data in the two charts that follow show that the largest gaps in the graduation rate exist mainly in the large urban districts. The large urban districts have a four year graduation rate of 50 percent and New York City’s four year rate is 56 percent. By contrast, the low need districts have an overall disaggregated four year graduation rate of 92 percent for the 2004 cohort.
Consistent with the overall disaggregated graduation rates shown in the chart above, the chart that follows shows that the large city districts also issue the largest percentage of local diplomas. For the 2004 cohort, 39 percent of students in large city school districts who graduated in four years did so with a local diploma, 28 percent of the students who graduated in four years in New York City did so with a local diploma. By contrast, only 9 percent of students in low need districts who graduated in four years received a local diploma.
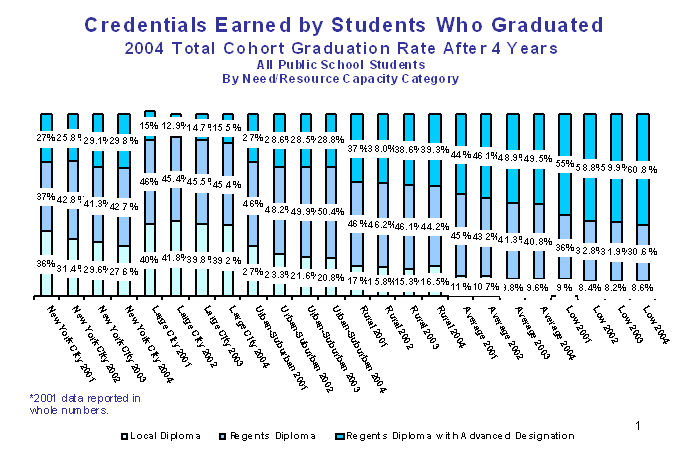
The next series of charts breaks down the data for the New York City School District as well as the other Big Five City School Districts (Buffalo, Rochester, Syracuse and Yonkers).
New York City:

Big 4 Cities:


Buffalo:


Rochester:


Syracuse:


Yonkers:


This data shows that strategies to address the needs of schools and students in urban districts are of particular importance if we want to raise graduation rates in New York State. Attachment C lists some of the initiatives that the Board of Regents and Department are engaged in to improve student achievement.
III. Setting Graduation Goals and Targets
Setting goals and targets for graduation is one of the most important decisions that the Regents will make. It is critical that there is an enhanced focus on graduating more students if we are to ensure the success of New York’s families and the economy. The federal government, which has also promised to infuse vast new sums of money into education, has asked states to adopt new, stronger, and more inclusive graduation rate requirements by this fall. Therefore, the Board has an immediate opportunity to adopt new definitions of graduation (for example, counting graduation rates for five or even six years instead of four years only) and set goals and targets for all disaggregated groups of students (e.g., by race/ethnicity, income, disabilities, and English language status). Schools and districts would then be held accountable for improving graduation rates using these more inclusive and more rigorous rules.
The new federal approach is consistent with the Board of Regents commitment to address critical policy issues that will impact on New York State’s graduation rate. Aligned with the Board of Regents policy, the federal regulations are intended to create a graduation rate that:
- Is accurate and ensures that students who drop out are not counted as “transfers”;
- Is comparable across states;
- Gives credit for students who take longer than four years to graduate;
- Ensures that states set an aggressive graduation rate goal and annual targets; and
- Holds schools accountable for improving graduation rates for all students and student accountability groups.
The federal government has asked that each state submit for peer review and USED approval a graduation rate goal and annual target(s) to be used for accountability decisions as early as with 2009-2010 assessment results.
Some of the changes will create additional challenges for states (i.e., the new federal definition of the graduation rate cohort). Others create new opportunities for states (i.e., using an extended year graduation rate). How the Regents choose to address these issues could impact on USED’s consideration of New York for Race to the Top funds under the American Recovery and Reinvestment Act (ARRA).
Over the next few months, the Board of Regents will be discussing several policy issues and data as they consider establishing a new accountability graduation rate goal and annual targets. The policy issues that members of the Board of Regents have identified are:
- Raising standards and aligning test cut scores with college readiness.
- Establishment of an aspirational goal for graduation of all students
- Establishment of an accountability goal for purposes of NCLB (especially in light of the new federal requirement concerning disaggregated graduation rates)
- Identification of technical issues and policy questions that must be addressed, including the definition of the graduation rate cohort and other factors to consider in setting the graduation rate.
- Policy issues related to the graduation safety net for students with disabilities.
- Policy issues related to the transition away from the local diploma.
- Standards for the GED.
A. Defining the Graduation Rate Cohort
How the graduation rate cohort is defined determines which students are being counted for accountability purposes. The federal government has asked that every state adopt the new federal four-year adjusted graduation rate cohort definition and use this definition beginning no later than with the 2011-2012 school year results.
While many states define graduation rate in a way that is very different from the proposed federal definition, New York’s current definition of the four-year cohort is very close to the proposed federal definition. However, there are three main changes that may be needed:
- Currently, students who have been enrolled in a particular school or district for less than five months are not counted in the cohort for school and district accountability (although we do count those students in the statewide cohort). This exclusion will not be permitted under the new federal definition.
- Currently, New York State considers all incarcerated youth as transfers and therefore do not include them in the cohort and do not hold schools and districts responsible for those students. The federal definition will only allow those incarcerated youth in programs that lead to regular high school diplomas to be considered transfers.
- Currently, New York State enters ungraded students with disabilities into a cohort based on the school year a student becomes 17 rather than when the student first becomes enrolled in a high school. The federal definition is likely to be interpreted to require that these students be assigned a grade and entered into a cohort based upon when they first entered 9th grade, as all other students are.
Factors to Consider:
While states are encouraged to begin using the federal definition as soon as possible, the federal government has asked that states begin to use the federal definition for accountability purposes no later than with the 2011-2012 school year results. The more quickly the federal definition is adopted, the less time schools and districts have to prepare for the changes. The Regents could decide to adopt the federal definition beginning with the 2009-2010 school year results or, in order to give
Schools and districts as much time as possible to prepare for this change, the Regents could decide to use the new targets for the 2011-2012 school year results to use the new definition.
Question for Discussion:
- When do the Regents want to begin using the new federal four year adjusted rate graduation cohort definition?
B. Setting the Graduation Rate Goal and Annual Target(s)
States must also disaggregate graduation rate data for determining AYP based on assessments administered beginning with the 2011-12 school year results. At present, high schools and districts are accountable for meeting this goal and target with the “all students” group, not with any of the NCLB disaggregated student groups. Currently, New York’s accountability graduation rate goal is 55% and the annual graduation rate target is a 1% increase for schools and districts below the goal.
Factors to Consider:
Because the same graduation rate goal will apply to each student group for which a high school or district is accountable and there is extremely wide variation in graduation rates among groups, a graduation goal that may seem extremely modest when applied, for example, to the “all students” group may be exceedingly challenging when applied to other student groups such as English language learners or students with disabilities. For the 2003 graduation cohort, the percentage of White students who graduated within four years was 82 percent while the rate for English language learners was 28 percent. Even if the Regents establish a very modest graduation goal, most schools and districts that are accountable for ELL’s will have to improve the graduation rate by the established targets for these students each year in order to make Adequate Yearly Progress.
Looking at the chart below we can see that as the graduation rate goal increases, the number of high schools that will not meet the goal for various student groups increases as well. For example, if the graduation rate was raised to 80 percent, it would result in 75 of the 102 high schools that are accountable for ELL students being identified as in need of improvement for that student group. (highlighted in yellow).
Distribution of Graduation Rate by Student Groups
2004 Total Cohort through August 2008
|
|
|
|
|
|
|
|
|
|
|
|
Graduation Rate |
all students |
American Indian/Alaska Native |
Asian or Pacific Islander |
Black |
Econ Disadvantaged |
Hispanic |
ELLs and Former ELLs |
SWD |
White |
|
less than 55 |
135 |
0 |
4 |
111 |
129 |
119 |
75 |
159 |
19 |
|
between 55-59 |
35 |
0 |
7 |
29 |
56 |
32 |
4 |
21 |
7 |
|
between 60-64 |
41 |
1 |
5 |
32 |
62 |
32 |
9 |
11 |
12 |
|
between 65-69 |
69 |
1 |
5 |
28 |
71 |
29 |
6 |
18 |
26 |
|
between 70-74 |
91 |
0 |
8 |
40 |
74 |
40 |
2 |
19 |
55 |
|
between 75-79 |
107 |
0 |
2 |
25 |
52 |
28 |
1 |
21 |
90 |
|
between 80-84 |
136 |
0 |
9 |
24 |
70 |
23 |
3 |
10 |
110 |
|
between 85-89 |
150 |
0 |
11 |
16 |
33 |
12 |
2 |
12 |
137 |
|
between 90-100 |
247 |
0 |
49 |
29 |
44 |
25 |
0 |
17 |
251 |
|
# of high schools accountable for each student group |
1011 |
2 |
1`00 |
334 |
591 |
340 |
102 |
288 |
707 |
If the graduation rate goal was set at 80%, a district that has a graduation rate for the “all students” group of 80% or higher but that has a graduation rate of 65% for students with disabilities would still be at risk for being identified as in need of improvement because that group of students has not met the goal.
Students with Disabilities
Setting a graduation rate goal and annual targets has additional policy implications for students with disabilities. Both the No Child Left Behind Act (NCLB) and the Individuals with Disabilities Education Act (IDEA) require states to report on the percent of students graduating with a regular diploma. In New York State (NYS), a regular diploma includes a Regents or local diploma. An individualized education program (IEP) diploma, which does not require a passing score on any State assessment, and a General Equivalency Diploma (GED) are not included in the State's measure of graduation rates.
IDEA requires states to set measurable and rigorous targets for improvement in the percentage of students with disabilities graduating with a regular diploma. In March 2009, the Federal Office of Special Education Programs (OSEP) issued its requirements for the Individuals with Disabilities Education Act (IDEA) State Performance Plan stating that each state’s targets for improvement must be the same as the annual graduation targets under Title I of the Elementary, Secondary Education Act (ESEA).
In 2005, the State established measurable and rigorous targets for graduation rates for students with disabilities in its State Performance Plan, based on its baseline performance of the 2002 total cohort and in consultation with stakeholders, as follows:
|
Federal Fiscal Year (FFY) |
Target |
|
FFY 2005 |
37 % |
|
FFY 2006 |
37 % |
|
FFY 2007 |
38 %. |
|
FFY 2008 |
44%. |
|
FFY 2009 |
49 %. |
|
FFY 2010 |
52%. |
We know that more than 50 percent of the students with disabilities who graduated with a regular high school local diploma relied on the Safety Net to do so. The Safety Net policy, which permits students with disabilities either to pass any Regents examination at a score of 55 or to pass Regents competency tests in order to earn a local diploma, is an important graduation policy that the Regents will need to discuss and act on in the fall. The current Safety Net for students with disabilities will, by regulation, be in place only for those students entering grade 9 in the 2009-10 school year. This new requirement, therefore, has significant implications for the decisions the Regents will make on the State’s annual graduation targets for all students. The graduation rate annual targets for students with disabilities must be rigorous, yet achievable.
Options for Setting Annual Targets
At present, most schools in New York State make Adequate Yearly Progress on the graduation rate indicator because their graduation rate for the “all students” group exceeds the current New York goal of 55 percent. Relatively few schools depend upon making AYP by demonstrating an annual improvement in their graduation rate. As discussed earlier, that is because AYP decisions are now made based on a school or district’s aggregate graduation rate, not on the graduation rate for student groups (i.e., students with disabilities, English language learners, etc.). When we begin disaggregating the data, more schools and districts will likely not meet the graduation rate goal for one or more disaggregated groups and will have to demonstrate that they have met the annual targets in order to make AYP. The methodology the Regents choose for establishing graduation rate targets will have a large influence on how challenging it will be for schools to make AYP.
The NCLB regulations give states considerable flexibility in how they establish graduation rate targets. Options available to the Regents for establishing these targets include but are not limited to:
- A Single uniform graduation rate target that requires all schools below the graduation rate goal to demonstrate the same amount of improvement each year in order to make AYP. New York’s current requirement that all schools below the 55 percent graduation rate goal improve by one percent annually is an example of a single uniform graduation rate target.
- Performance bands that establish targets based on a group’s current graduation rate and require different levels of growth for each band. Those groups in a lower band would be required to demonstrate a greater increase than those in bands that are close to the graduation rate goal.
- Gap reduction in which the farther away a group is from the graduation rate goal the greater the percentage of improvement the group must demonstrate. NCLB’s safe harbor methodology, which requires certain schools to show a ten percent annual reduction in the percentage of students not proficient in English language arts or mathematics, is an example of a gap reduction methodology.
- Floor and growth in which groups below a certain minimum level would not be able to make AYP regardless of how much growth was made. Those above the minimum would need to make specified improvement in order to make AYP.
In judging the targets established by states, USED has indicated that it will consider how long it would take a school or district to achieve the state graduation rate goal if the school or district were to make the minimum required gain each year. For example, if a school had a graduation rate of 50% for a group and the state had a graduation rate goal of 90% and a minimum improvement target of 1% per year, it would take this school 40 years to achieve the goal if it made the minimum required gain each year.
A target such as the one described above is not recommended. However, the more rigorous the graduation rate targets established the greater number of schools and districts that will not make AYP and therefore be identified for improvement. Extensive modeling will be necessary to identify targets that are both realistic and substantial. In conjunction with the Parthenon Group, Department staff is developing an analytic tool that will allow the Regents to calculate the number of schools that would have made AYP when different goals, targets, cohorts, and methodologies are used. We plan to demonstrate this tool to the Regents at the June meeting.
The earlier a new, more rigorous graduation rate goal and annual targets are applied, the less time schools and districts have to improve outcomes to meet the goal and targets. For example, if the new goal and targets were applied to 2009-2010 school year results, schools and districts would have no opportunity to influence these outcomes since they would be based on students who graduated through August 2009. Even if the Regents delayed applying the new goal and targets until the 2011-2012 school year, this goal and target would be measured against the graduation rate for students who would be entering their third year of high school in 2009-2010. Thus schools and districts would have only a limited amount of time to influence these results. The USED has thus far not made clear whether a state may establish a timeline that sets a graduation goal that is raised over a period of years.
Question for Discussion:
- How rigorous do the Regents want the accountability graduation rate goal and annual target(s) to be?
C. Using an Extended Year Adjusted Graduation Rate
The federal regulations permit states to base AYP determinations in part on the performance of students who graduate in more than four years. This is a practice that NYS has already employed, however, August graduation and a five and six year graduation rate has not counted for accountability purposes. USED guidance suggests that states seeking to implement a five year extended graduation rate will likely be approved. Those states that wish to implement a six or more year extended graduation rate will be asked to provide additional documentation to support the use of an extended graduation rate of such length. If a state chooses to implement an extended year graduation rate cohort, the state must decide how the extended graduation rate will be used in combination with the four year graduation rate for making AYP decisions.
Factors to consider:
Implementation of an extended graduation rate gives schools and districts credit for students who are able to graduate from high school in more than four years. An extended graduation rate provides schools and districts with additional incentive to continue to work with students to ensure that they graduate, even if they graduate in more than four years. Some believe that an extended graduation rate adds complexity to the system and could diminish the focus of schools and districts on ensuring that students graduate within four years. Data suggests, however, that many schools have significant numbers of students who graduate after five years. The numbers of students who graduate in six years is much fewer.
Use of an extended five or six year graduation rate is an important factor for students with disabilities because most students with disabilities require more time to earn the credits and pass the challenging State assessments to graduate. Policy should support a school district's efforts to keep students with disabilities in school for as long as it takes them to earn a regular diploma.
If the Regents decide to use an extended year cohort, they can decide to give schools and districts credit for making AYP so long as the school or district achieves the goal or the target(s) on either the four year cohort or the extended year cohort or create an index that combines the four year and the extended year graduation rates and use that as the basis for AYP determinations.
Giving schools and districts credit for making AYP by achieving either the four year adjusted rate graduation rate goal or targets or the extended-year goal or targets is straightforward, easy to understand, and beneficial to the ability of schools and districts to make AYP. Creating an index, while more complicated, allows the state to continue to give greater weight to the success of schools and districts in having students graduate in four years while also giving schools and districts some credit for students who graduate in more than four years.
Questions for Discussion:
- Do the Regents want to use an extended-year adjusted cohort graduation rate (or rates)?
- If the Regents wish to use an extended-year adjusted cohort rate, how should this rate be factored into making Adequate Yearly Progress determinations?
Timeline and Next Steps
Given the importance of improving the graduation rate for all students, the Board of Regents and Department are engaged in the analysis concerning all of the policy issues connected to establishing appropriate graduation rate goals and annual targets for accountability purposes now and look to make these decisions no later than the September/October 2009 Regents meetings.
In order to facilitate the policy decisions that the Regents have to make, staff is developing some data models to show the impact of specific goals and targets. That data model will be demonstrated at the June meeting of the Board of Regents. This tool will inform the policy discussion on the impact of proposed goals and annual targets. With additional direction from the Regents, staff will prepare additional data and models for the Regents discussion in July. Based on that discussion, staff will prepare policy recommendations for the Regents discussion and decision in September/October. We will inform the Regents if we receive additional guidance from USED that indicates that a different timeline is needed.
Over the next several Regents meetings we will be bringing policy questions on the issues discussed at the beginning of this item to the Regents for discussion and decision. The policy questions that we recommend the Regents discuss at the June meeting are:
- How rigorous do the Regents want the accountability graduation rate goal and annual target(s) to be?
- Do the Regents want to use an extended-year adjusted cohort graduation rate (or rates)?
- When do the Regents want to begin using the new federal four year adjusted rate graduation cohort definition?
- Do the Board of Regents wish to continue to implement the phase out of the local diploma?
Attachment A

|
Attachment B State Graduation-Rate Goals and Improvement Targets for the Class of 2007 |
|||
|
State |
Graduation-Rate Goal for the Class of 2007 |
Annual Improvement Target |
|
|
Alabama |
90% |
Any progress |
|
|
Alaska |
55.58% |
Any progress |
|
|
Arizona |
71% |
One percentage point |
|
|
Arkansas |
73.9% |
Any progress |
|
|
California* |
83% |
0.1 percentage point over one year of 0.2 percentage points over two years |
|
|
Colorado* |
59.5% |
N/A |
|
|
Connecticut |
70% |
Any progress |
|
|
Delaware* |
79.5% |
Equal or exceed previous year’s graduation rate |
|
|
District of Columbia |
66.23% |
One percentage point |
|
|
Florida |
85% |
1% |
|
|
Georgia* |
65% |
10% (if 50% threshold is reached) |
|
|
Hawaii* |
80% |
N/A |
|
|
Idaho |
90% |
Any progress |
|
|
Illinois* |
72% |
N/A |
|
|
Indiana |
95% over two years |
Any progress over 2-year period |
|
|
Iowa |
90.3% |
Any progress |
|
|
Kansas |
75% |
Any progress |
|
|
Kentucky* |
84.5% |
Any progress |
|
|
Louisiana |
65% |
0.1 percentage point |
|
|
Maine* |
64% |
N/A |
|
|
Maryland* |
85.5% |
0.01 percentage point |
|
|
Massachusetts |
60% |
Two percentage points |
|
|
Michigan* |
85% |
10% reduction in difference between actual rate and goal over two years |
|
|
Minnesota |
80% |
Any progress |
|
|
Mississippi |
72% |
Any progress |
|
|
Missouri |
85% |
Any progress |
|
|
Montana |
80% |
Any progress |
|
|
Nebraska |
83.97% |
Any progress |
|
|
Nevada |
50% |
Any progress |
|
|
New Hampshire |
75% |
Any progress |
|
|
New Jersey |
N/A |
N/A |
|
|
New Mexico |
90% |
Current year rate equals or exceeds previous year’s rate, or rate averaged over three years equals or exceeds previous year’s rate |
|
|
New York |
55% |
One percentage point |
|
|
North Carolina |
80% |
0.1 percentage point |
|
|
North Dakota |
73.09% |
N/A |
|
|
Ohio |
73.6% for current year or two-year average |
Any progress |
|
|
Oklahoma* |
67.8% |
Any progress |
|
|
Oregon |
68.1% for current year or for two-year weighted average |
N/A |
|
|
Pennsylvania |
80% |
Any progress |
|
|
Rhode Island* |
79.2% |
N/A |
|
|
South Carolina |
88.3% |
Current year rate equals or exceeds previous year’s rate, or rate averaged over three years equals or exceeds previous year’s rate |
|
|
South Dakota |
80% |
Any progress |
|
|
Tennessee |
90% for current year, most recent two years’ worth of data, or three-year rolling average |
Individually set for each school |
|
|
Texas |
70% |
Any progress |
N/A = Improvement targets not specified in state accountability workbooks.
Source: Consolidated State Application Accountability Workbooks posted on the U.S. Department of Education Web site as of August 2008 and state departments of education documents. |
|
Utah |
85.7% |
Any progress |
|
|
Vermont |
72% |
N/A |
|
|
Virginia* |
61% |
Any progress |
|
|
Washington* |
69% |
Two percentage points |
|
|
West Virginia |
80% |
Any progress |
|
|
Wisconsin |
90% of state average |
Any progress |
|
|
Wyoming |
80% |
Any progress |
|
Attachment C
The Board of Regents is a nationally recognized leader in raising standards, holding schools accountable, and supporting students in improving student achievement. The Regents were among the first to raise standards, measure those standards through required statewide tests, issue School Report Cards, and disaggregate achievement data so disadvantaged students of all kinds could be counted and helped. The Regents have also adopted curriculum guidance for all the major subject areas and have required that schools provide extra help to students who did not achieve the standards. The Regents were the first to create and urge adoption of a Foundation Formula for State Aid that has resulted in record amounts of funding to support high need schools. The Regents also eliminated the 16,000 uncertified teachers statewide and have taken actions to raise standards for teachers, create alternative pathways to becoming a teacher, and reduce the teacher shortage.
Aggressively attacking the performance gap and increasing high school graduation for all students in the State is a priority of the Board of Regents and the New York State Education Department. The first step needed to help increase graduation rates in the State, particularly for populations which have low graduation rates, is to improve student learning and achievement. The Regents have embarked on a number of critical initiatives towards this end including:
- The Regents and Department are strongly advocating for universal prekindergarten (UPK) and full day kindergarten opportunities for children across New York State. There are still too many children (estimated at 14,000 eligible four year olds) who are not currently being served by UPK programs.
- As a result of funding through Title I, IDEA, State Aid, etc., a number of initiatives are in place in low performing schools including additional time on task, literacy education, teacher training, etc.
- The Regents and Department successfully advocated for the Foundation Formula and major increases in State Aid for high need districts. The Contracts for Excellence help determine how a portion of that money will be spent to help students in the greatest need.
- The Regents and Department are working with our educational partners to develop and implement a P-16 data system to provide critical information to school leaders and teachers to help strengthen teaching and learning and to ensure more students can be provided the necessary assistance to graduate on time.
- The Regents and Department are currently reviewing the learning standards to ensure that students in our PreK-12 schools are being provided with the highest quality instruction to ensure that at the end of Grade 12 they are college-ready and can enter postsecondary education without the need for remediation. The Regents are working on the first set of standards for English language arts and English as a second language.
- The Regents have convened an Urban Education Work Group designed to examine the best ways in which we can strengthen the preparation, induction, and retention of urban educators. Studies have shown that the quality of the teaching force is the single most important variable in strengthening student learning and achievement. The performance gap exists in our high needs schools, many of which are located in our urban communities and this initiative is targeted at strengthening our ability to teach students in high need schools.
- Consistent with our work with teachers, the Regents are also developing a system to strengthen professional development for school leaders in New York State. The Cohesive Leadership System, funded through a grant from the Wallace Foundation, will transform the way we prepare school leaders, provide professional development to them, and developing an appropriate school leader assessment system. Quality school leaders are a key variable in turning around troubled schools. Case studies as well as quantitative studies have demonstrated that quality school leadership is the key variable in school turnaround.
- The Regents and the Department have been working, over the past few years, in strengthening the teacher certification system to help ensure that there is an equitable distribution of teachers across the State, especially in our high need communities. The Regents have enacted flexibility by way of alternative teacher certification programs, the ability to receive credit towards a Language Other than English teaching certificate through examinations, the development of a supplementary certificate to allow certified teachers to begin to teach in another subject area before they complete their program, and the development of a bilingual education extension supplemental certificate to try to facilitate the certification of more bilingual teachers for our high need districts. More work needs to be done, especially in the area of special education and the sciences.
- The Regents have also applied for a private foundation grant to create Early College High Schools across New York State (the Smart Scholars Program). Research has shown that students who are educationally at risk respond to challenges provided by Early College High Schools and provides them with greater opportunities to graduate from high school and to receive college credit for coursework completed during a high school program. This is another researched-based strategy being used by the Board of Regents to assist students who are most at-risk of not completing high school.
- The Department’s Project Management Office (PMO) is currently analyzing the structure of the State Education Department for the purpose of transforming the Department to be more of a service oriented organization that will focus on providing technical assistance to school districts as opposed to individual schools. This redesign will allow the Department to work more efficiently with those school districts that have high need schools or graduation rates which are well below the average.
- Strengthen career and technical education. The Regents have confirmed their strong belief that CTE, with its focus on relevance, rigor, and relationships, will help to close the achievement gap and raise the graduation rate. We are focusing on 7 major Content Areas with specific action steps for each area that will help support and grow CTE.
- Finally, from the lessons learned from past work and the data analysis, the Regents will be advancing to the Governor initiatives in New York State’s Race to the Top application to help fund additional initiatives resulting in a coherent strategy that will ensure that all students, especially those that are in the performance gap, are able to graduate from high school and continue on to postsecondary education.
A school must have at least 30 students in a group to be accountable for that student group.


 VESID Committee